
Once you have your retirement figure calculated using the steps outlined in my earlier article, you need to work backwards from that and work out how much you need to invest each month to get to that final figure.
In this article I will help explain in simple steps how to use a spreadsheet developed for exactly that by renowned Harvard Professor of finance Michael E Edleson
A brief on Michael E Edleson
Michael is a Managing Director of Morgan Stanley and oversees the firm’s equity risk globally. Prior to that, he was Chief Economist of NASDAQ and a finance professor at Harvard Business School. Edleson earned his PhD at MIT.
Michael Edleson is also well renowned for first introducing his concept of “value averaging” (which is similar to but different from SIP) to the world in an article written in 1988. He then wrote a book entitled Value Averaging in 1993, which has been nearly impossible to find until now.
Full credits therefore due to him for this article. His spreadsheet can be downloaded from this link. Alternately, feel free to message me if you would like me to send you Michael’s Excel sheet.
How to use the spreadsheet
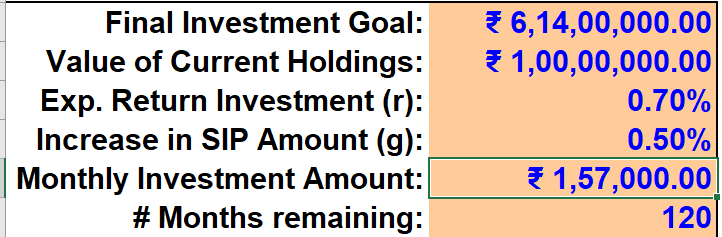
Final investment goal: Cell D3
Your final retirement amount from the the steps outlined in my earlier article goes in the cell next to Final investment Goal
Value of current existing equity investments: Cell D4
Enter the current value of your equity / stock market assets / holdings in the cell labelled “Value of current holdings”. The value you enter here is the value of your existing investments in Equity. So for example, let’s say you’ve been investing in equity mutual funds for the last 10 years and that has already grown to a value of say 1 crore, then you enter that current value here in cell D4.
Note that if you have other investments like a home or any other real estate, PPF, FDs or other non equity / stock market investments that value should not be entered here. This is because the sheet assumes that these investments will grow at the rate at which equity investments will rise. You need to calculate the final value of these investments separately assuming growth at a typical FD rate.
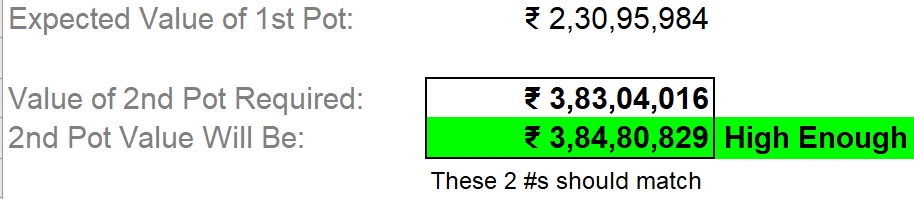
Note1: The cell labelled Expected value of 1st Pot tells you how much this will grow to at the end of your specified time period e.g. 10 years in this example
Expected return on investments Cell D5
Here you are being asked to estimate the average return you expect to get from your equity investments. Note that what you enter in this cell is a MONTHLY rate of expected return not an annual rate.
This is tricky and there is no easy or correct answer. To play it safe, you might want to look at historical data on returns of the Sensex of Nifty over the last 20 to 30 years. Typically pre-tax this return has been in the vicinity of 10%. But as with all things in finance, it’s always be cautious and err on the safer side i.e. in this case assume the lowest possible returns. So I would pick a monthly return rate of a max of 0.8% or better still somewhere between 0.7% and 0.8% per month
Months remaining till you reach retirement: Cell D8
If retirement is 10 years away that’s 120 months and so that’s what you would enter in cell D8 titled “# months remaining”
Increase in SIP amount: Cell D6
Under “Increase in SIP amount (g)” enter the percentage by which you think you can increase your SIP each month. Note that this is MONTHLY increase figure not annual.
So if for example you expect to be able to increase your SIP by say 6% per year, you would enter 0.5 in this cell i.e. indicating a 0.5% per month possible increase in SIP
Playing with the numbers to get to the required monthly SIP amount
Now keep adjusting the number in cell D7 until cell E13 becomes Green and indicates “High enough” like in the picture below. This value of D7 is the monthly SIP you need to start with to hit your retirement goal. Note also that you need to increase your SIP amount each month by what you indicated in Cell D6.
In this example, one needs to invest Rs. 1.57 lakhs each month to get to the retirement target
Two items to note for additional clarity.
a) Cell D10 indicates what the value of your current existing equity holdings (indicated in cell D4) will grow to at the end of 10 years.
b) Cell D13 indicates what amount your monthly SIP will grow to by your retirement date
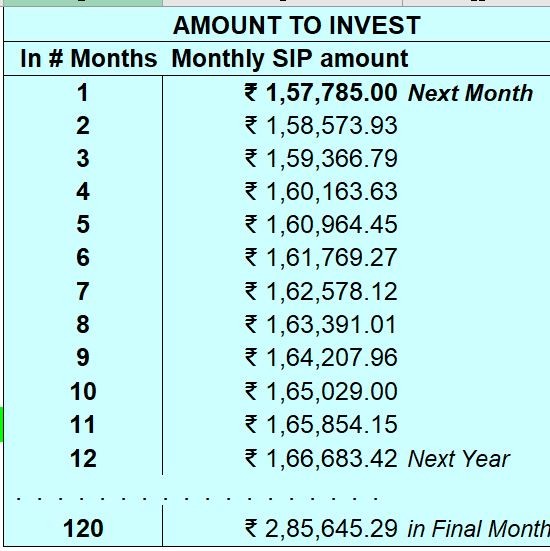
Lastly, for clarity, columns F to K list the actual expected monthly investment from the first month until the last.
Feel free to reach out to me if you have any difficulty using the spreadsheet.
Summary
With a clear target retirement amount and a clear monthly SIP investment figure you now have a clear plan to hit your retirement target. This I expect will provide many of you with a great sense of peace of mind. With a clear plan like this it’s also half the battle won. Happy investing !